The A-Z of Open Source GIS Technologies: A Complete Guide for Geospatial Developers
Introduction
As a geospatial developer working with location-based systems, I’ve witnessed the remarkable evolution of the Open Source GIS ecosystem over the past decade. What was once dominated by expensive proprietary software has transformed into a rich landscape of powerful, community-driven tools.
Today, you can build enterprise-grade spatial applications without paying a single dollar in licensing fees. The combination of modern architectures—Cloud-Native, AI Integration, and Vector Tiles—with open-source tools provides capabilities that rival (and often exceed) commercial alternatives.
I decided to curate this comprehensive A-Z guide to help fellow developers navigate this ecosystem. Whether you’re building a simple web map or a complex spatial data pipeline, there’s a tool here for you.
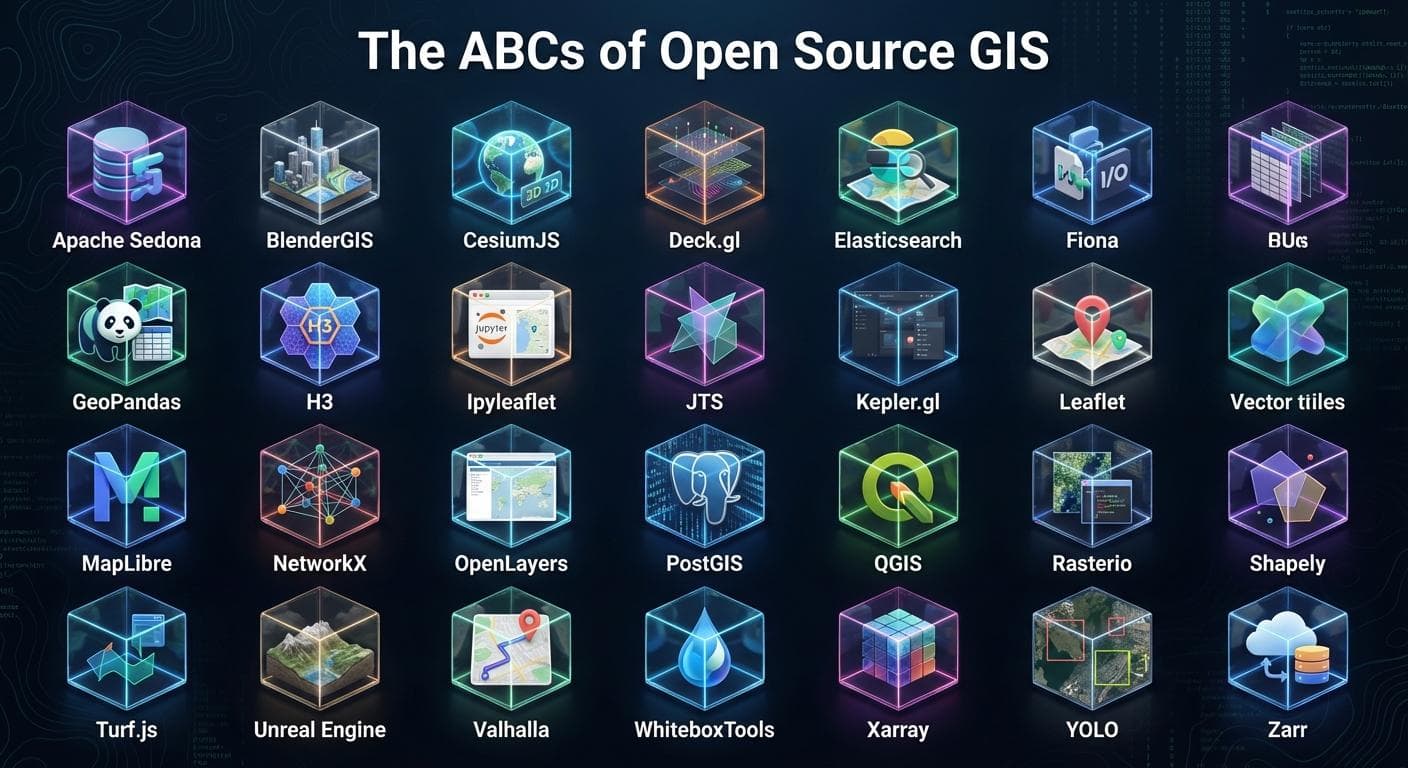
The Complete A-Z List
A - Apache Sedona
Category: Big Data Processing
Apache Sedona (formerly GeoSpark) extends Apache Spark and Apache Flink with spatial capabilities. It’s designed for processing massive geospatial datasets at scale.
Best for:
Processing billions of spatial records
Distributed spatial joins and queries
ETL pipelines for geospatial data lakes
Quick Example:
        python


      from sedona.spark import SedonaContext

sedona = SedonaContext.create(spark)
df = sedona.sql("SELECT ST_GeomFromWKT('POINT(-74.006 40.7128)') as geometry")
B - BlenderGIS
Category: 3D Visualization
BlenderGIS is an addon for Blender that bridges the gap between GIS and 3D modeling. It allows you to import real-world terrain, buildings, and geographic data directly into Blender.
Best for:
Creating 3D terrain visualizations
Urban planning presentations
Photorealistic map renders
C - CesiumJS
Category: 3D Globes & Visualization
CesiumJS is the leading open-source JavaScript library for creating 3D globes and maps. It supports 3D Tiles, terrain visualization, and time-dynamic data.
Best for:
3D globe applications
Visualizing satellite imagery and terrain
Flight path and trajectory visualization
Quick Example:
        javascript


      const viewer = new Cesium.Viewer('cesiumContainer', {
  terrainProvider: Cesium.createWorldTerrain()
});
D - Deck.gl
Category: Large-Scale Data Visualization
Developed by Uber’s visualization team, Deck.gl is a WebGL-powered framework for visual exploratory data analysis of large datasets.
Best for:
Visualizing millions of points
Trip and trajectory animations
Heatmaps and hexagonal aggregations
Quick Example:
        javascript


      import {HexagonLayer} from '@deck.gl/aggregation-layers';

const layer = new HexagonLayer({
  data: points,
  getPosition: d => [d.longitude, d.latitude],
  radius: 1000,
  elevationScale: 50
});
E - Elasticsearch
Category: Spatial Search & Indexing
Elasticsearch provides powerful geo-queries including geo-shape, geo-point, and geo-bounding box searches with lightning-fast performance.
Best for:
Location-based search (find nearby)
Spatial filtering at scale
Real-time geospatial analytics
F - Fiona
Category: Data I/O
Fiona is a Python library that provides a clean, Pythonic interface for reading and writing geospatial vector data. It’s built on top of GDAL/OGR.
Best for:
Reading/writing Shapefiles, GeoJSON, GeoPackage
Streaming large datasets
Format conversion pipelines
Quick Example:
        python


      import fiona

with fiona.open('data.shp') as src:
    for feature in src:
        print(feature['geometry'])
G - GeoPandas
Category: Spatial Data Analysis
GeoPandas extends Pandas to support spatial data types and operations. It’s the go-to library for geospatial data analysis in Python.
Best for:
Spatial joins and overlays
Data manipulation and cleaning
Exploratory spatial data analysis
Quick Example:
        python


      import geopandas as gpd

gdf = gpd.read_file('neighborhoods.geojson')
gdf['area_km2'] = gdf.geometry.area / 1e6
gdf.plot(column='area_km2', cmap='viridis')
H - H3
Category: Spatial Indexing
H3 is Uber’s hierarchical hexagonal spatial indexing system. It provides a consistent grid system for aggregating and analyzing spatial data.
Best for:
Spatial aggregation and binning
Consistent grid-based analysis
Ride-sharing and logistics optimization
Quick Example:
        python


      import h3

lat, lng = 40.7128, -74.0060
hex_id = h3.geo_to_h3(lat, lng, resolution=9)
neighbors = h3.k_ring(hex_id, 1)
I - ipyleaflet
Category: Interactive Mapping (Jupyter)
ipyleaflet brings Leaflet maps to Jupyter notebooks with full interactivity and widget integration.
Best for:
Interactive maps in notebooks
Data science workflows
Prototyping map applications
J - JTS (Java Topology Suite)
Category: Geometry Operations
JTS is the foundational geometry library that powers most open-source GIS tools. GEOS (used by PostGIS, Shapely) is a C++ port of JTS.
Best for:
Geometric computations
Topology validation
Spatial predicates and relationships
K - Kepler.gl
Category: No-Code Visualization
Kepler.gl is a powerful open-source geospatial analysis tool for large-scale datasets. It requires no coding and produces stunning visualizations.
Best for:
Quick data exploration
Creating shareable map visualizations
Non-technical stakeholder presentations
L - Leaflet
Category: Web Mapping
Leaflet is the most popular open-source JavaScript library for mobile-friendly interactive maps. It’s lightweight, simple, and extensible.
Best for:
Simple web maps
Mobile-first applications
Quick prototypes
Quick Example:
        javascript


      const map = L.map('map').setView([51.505, -0.09], 13);
L.tileLayer('https://{s}.tile.openstreetmap.org/{z}/{x}/{y}.png').addTo(map);
L.marker([51.5, -0.09]).addTo(map).bindPopup('Hello World!');
M - MapLibre
Category: Vector Tile Rendering
MapLibre GL JS is the open-source fork of Mapbox GL JS. It’s the leading solution for rendering vector tiles with WebGL.
Best for:
Vector tile applications
Custom map styling
High-performance web maps
Quick Example:
        javascript


      const map = new maplibregl.Map({
  container: 'map',
  style: 'https://demotiles.maplibre.org/style.json',
  center: [-74.5, 40],
  zoom: 9
});
N - NetworkX
Category: Network Analysis
NetworkX is a Python library for studying complex networks. Combined with OSMnx, it’s powerful for street network analysis.
Best for:
Shortest path calculations
Network connectivity analysis
Graph-based spatial analysis
O - OpenLayers
Category: Web Mapping
OpenLayers is a full-featured, highly customizable JavaScript mapping library. It supports a wide range of data sources and projections.
Best for:
Complex web mapping applications
Enterprise GIS portals
Applications requiring advanced projections
P - PostGIS
Category: Spatial Database
PostGIS extends PostgreSQL with spatial types, indexes, and functions. It’s the gold standard for spatial databases.
Best for:
Storing and querying spatial data
Complex spatial SQL operations
Backend for web mapping applications
Quick Example:
        sql


      SELECT name, ST_Area(geom::geography) as area_m2
FROM parks
WHERE ST_DWithin(
  geom::geography,
  ST_MakePoint(-74.006, 40.7128)::geography,
  1000
);
Q - QGIS
Category: Desktop GIS
QGIS is the leading open-source desktop GIS application. It provides data viewing, editing, and analysis capabilities comparable to ArcGIS.
Best for:
Data visualization and cartography
Geoprocessing workflows
Plugin development (PyQGIS)
R - Rasterio
Category: Raster Data Processing
Rasterio is a Python library for reading and writing geospatial raster data. It provides a Pythonic interface to GDAL.
Best for:
Satellite imagery processing
DEM analysis
Raster calculations
Quick Example:
        python


      import rasterio

with rasterio.open('elevation.tif') as src:
    elevation = src.read(1)
    print(f"Min: {elevation.min()}, Max: {elevation.max()}")
S - Shapely
Category: Geometry Manipulation
Shapely is a Python library for manipulation and analysis of planar geometric objects. It’s the geometry engine behind GeoPandas.
Best for:
Buffer operations
Intersection and union
Geometric predicates
Quick Example:
        python


      from shapely.geometry import Point, Polygon

point = Point(0, 0)
buffer = point.buffer(10)
print(f"Buffer area: {buffer.area}")
T - Turf.js
Category: Client-Side Analysis
Turf.js is a JavaScript library for spatial analysis. It runs entirely in the browser, enabling client-side geoprocessing.
Best for:
Browser-based spatial analysis
Real-time calculations
Reducing server load
U - UTFGrid
Category: Interactivity
UTFGrid is a specification for encoding interaction data alongside map tiles, enabling fast hover and click interactions.
Best for:
Adding interactivity to raster tiles
Tooltip information on maps
Legacy tile-based applications
V - Valhalla
Category: Routing Engine
Valhalla is an open-source routing engine with support for multiple transportation modes, isochrones, and map matching.
Best for:
Turn-by-turn navigation
Isochrone generation
Fleet routing optimization
W - WhiteboxTools
Category: Geomorphometric Analysis
WhiteboxTools is an advanced geospatial data analysis platform with over 450 tools for processing raster, vector, and LiDAR data.
Best for:
Hydrological modeling
Terrain analysis
LiDAR processing
X - Xarray
Category: Multidimensional Arrays
Xarray provides N-dimensional labeled arrays and datasets in Python. Combined with rioxarray, it’s powerful for climate and satellite data.
Best for:
Climate data analysis
Satellite time series
NetCDF/HDF5 processing
Y - YOLO (GeoAI)
Category: Object Detection
YOLO (You Only Look Once) and similar deep learning models are increasingly used for detecting objects in satellite and aerial imagery.
Best for:
Building detection
Vehicle counting
Land use classification
Z - Zarr
Category: Cloud-Native Storage
Zarr is a format for storing chunked, compressed, N-dimensional arrays. It’s designed for cloud-native workflows.
Best for:
Cloud-optimized data storage
Parallel data access
Large satellite imagery archives
Building Your Stack
Here’s how I typically combine these tools for different use cases:
Web Mapping Application
        scss


      PostGIS → GeoPandas (preprocessing) → MapLibre (frontend)
Big Data Pipeline
        scss


      Apache Sedona → H3 (indexing) → Zarr (storage) → Deck.gl (visualization)
Desktop Analysis
        nginx


      QGIS → Rasterio/GeoPandas → WhiteboxTools
AI/ML Pipeline
        nginx


      Rasterio → Xarray → YOLO → PostGIS (results storage)
Conclusion
The open-source GIS ecosystem has never been stronger. These 26 tools represent just a fraction of what’s available, but they form a solid foundation for building modern geospatial applications.
What tools would you add to this list? I’d love to hear about alternatives or tools I might have missed. Share your thoughts in the comments below!
Tags: GIS, Open Source, Geospatial, Python, PostGIS, MapLibre, QGIS, WebGIS, Data Visualization, GeoPandas, Spatial Analysis, Cloud-Native, GeoAI